
Where is the line drawn between seeing the big picture and being detail-oriented? In the world of business intelligence, finding the balance between the two can make the difference between success or failure.
Recently I’ve been working with Domo, a business intelligence software, to perform simple data analysis and reporting. In this work I’ve inherited a report-making process and a dashboard that was created by a predecessor. Some aspects of the project have been straightforward and simple while other aspects have been more complex. Throughout this project, I’ve developed a couple thoughts and ideas that I’d like to share. These deal with my experience with report-making in general, as well as reports specifically made with Domo.
Inheriting a project
Thinking back on all the previous projects that I’ve worked on, I would say that more than half of those projects were ones that I’ve either inherited, left for someone to inherit or both. This is to say that myself or my team weren’t the only analysts to work on the project.
Whenever this happens, there always seems to be an internal dialogue that I have with myself. Why did they place this chart here? What’s the purpose of this repository? How can I make this my own? Who is the client and how will they benefit from this work?
All these types questions revolve around the seeing big picture and being detail-oriented. While the maximizing the overall impact of the project is the main goal, this is accomplished through the small details. At the same time, focusing too much on a minor detail can make one lose sight of the big picture.
Seeing the big picture with Domo
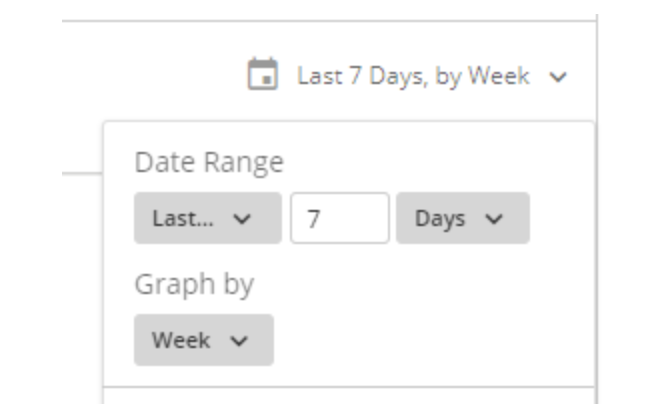
Here is an example of finding this balance in my latest project creating a Domo dashboard. I was interested in showing data for the previous three weeks broken up by week. The goal was to make this dynamic so that the previous three week data was always appropriate to the current date.
The card/visualization making process in Domo is powerful in the sense that filters for your data can be implemented simply with the click of a mouse. Creating a card that showed data for the previous week is simple and straight forward as one can choose to select data from the last 7 days. The tricky part came with showing the data for the weeks before the previous week.
Domo has their own method for functions used to wrangle the data and it’s called beast mode. The solution ultimately came with using a series of these beast mode functions in order to create the necessary cards. Figuring out which functions to input to these calculations was a long, drawn-out process. I was deeply relieved and felt accomplished after figuring out the appropriate functions.
Unfortunately, this sense of accomplishment came crashing as I pondered the usefulness of the calculations I created. Again, with the same internal dialogue I asked myself, Who will be seeing this? Why will they care about the last three weeks? Does this accomplish the ultimate purpose of the dashboard?
In this case, I found that my meticulous work was a solution to a problem that did not need to be solved. I focused too much on a minor detail and lost sight of the big picture.
Finding the balance
This experience of mine was not the first time I had become lost in the details and it will not be the last. Developing a balance between being detail oriented and seeing the big picture is key for any data analyst. While working hard to refine data and create calculations, it’s important to take a step back every now and then and ask the big picture questions.