Where do R and BI tools meet?
R is a powerful statistical programming language that is one of the main tools in a data scientist’s bag of tricks. It can be used to wrangle untidy data, perform statistical and predictive analysis and visualize it a meaningful way. It is an open-source language with a growing community of users, many of whom contribute new packages to increase R’s capacity for analysis. R is certainly a niche but powerful skill to have when performing data analysis.
On the other hand, there exists BI tools such as Microsoft’s Power BI, Tableau, Domo and much more. These are software meant to retrieve, transform and present data in a beneficial way to influence decision making. The “Business” aspect of BI tool really comes out as organizations implement these tools to allow decision makers and leaders to make data-educated choices. These software are often proprietary and require paid licenses for use.
In the summer of 2019, I had the opportunity to intern with a leading company in the organic food space as a data analyst. In one of my projects I was tasked with developing a dashboard for the Quality Assurance team to describe specific trends in KPIs. While my background strength was primarily in data wrangling and visualization in the R language, the company I worked for had the Microsoft license for Power BI and needed a final product in Power BI.
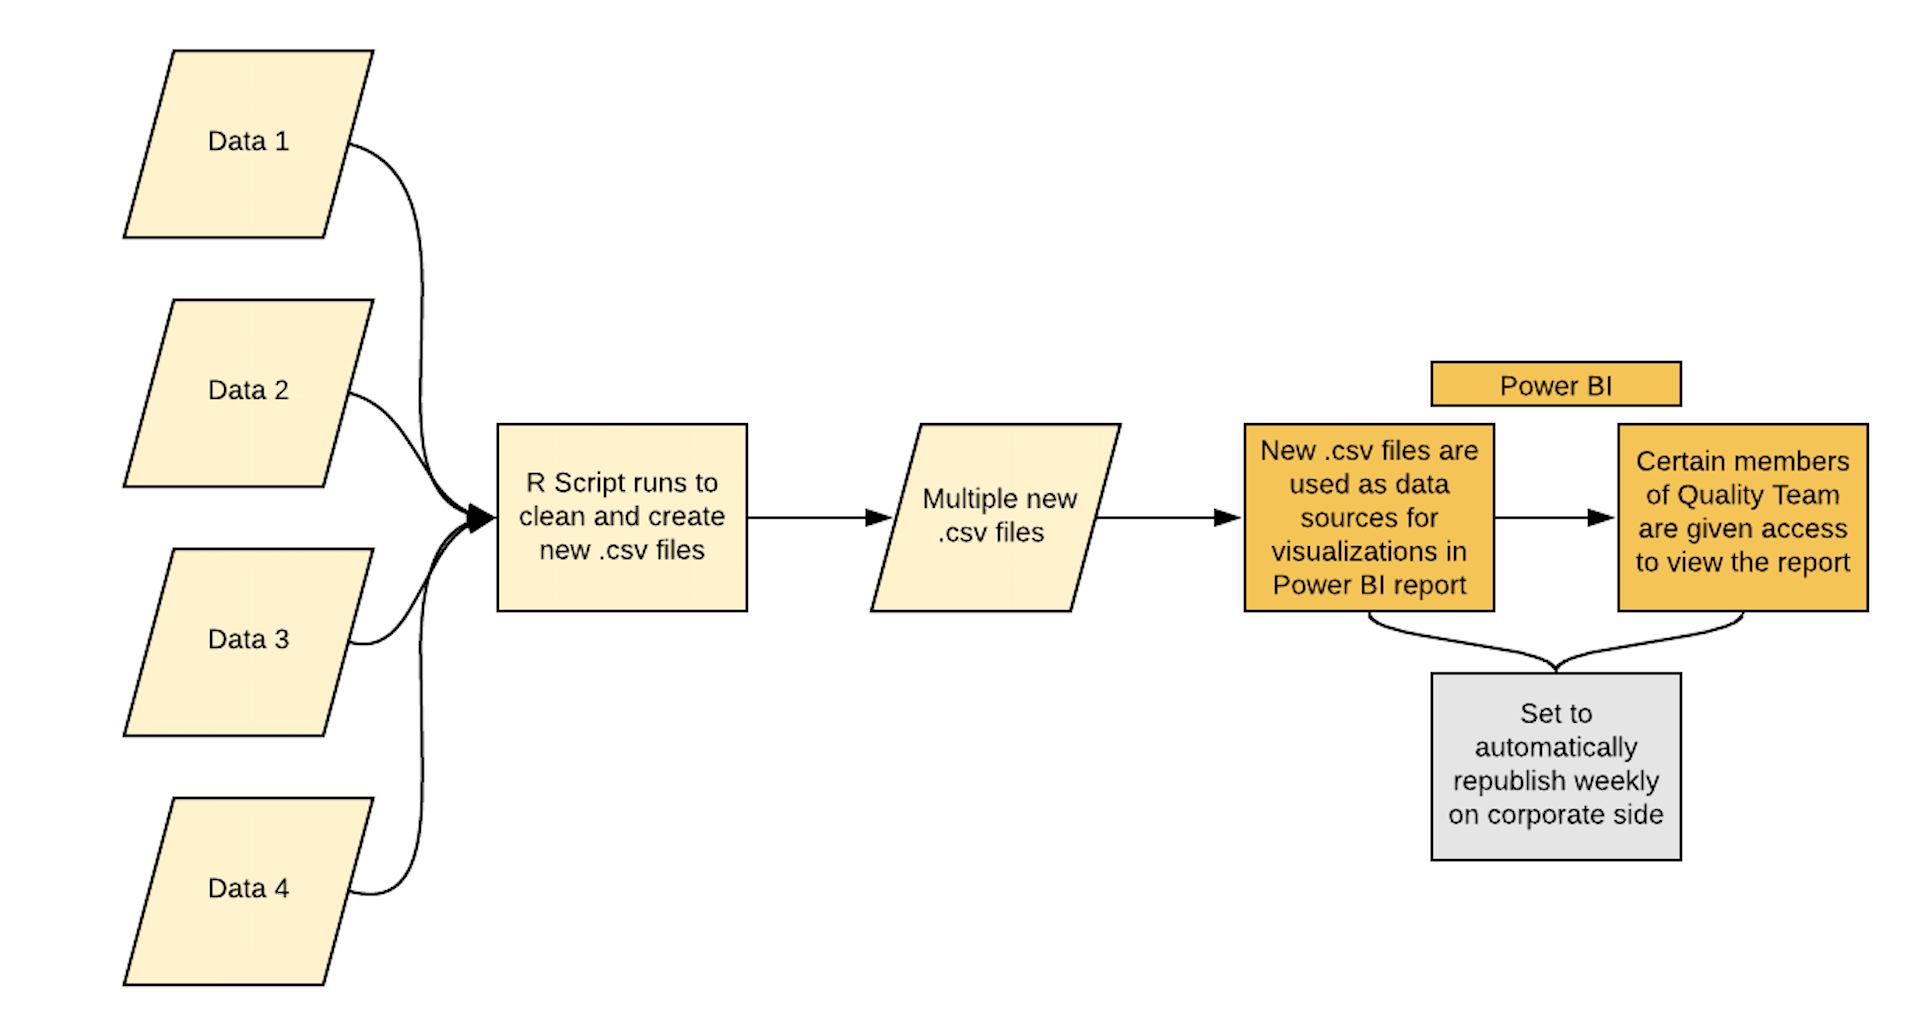
My ultimate workflow ended up finishing like this.
As I worked through the quirks of this project, I came to realize three important lessons about working with R and a BI tool.
1. It’s possible to have an integrated workflow with R and your BI tool but not entirely convenient or friendly.
2. Determine which tool to use for wrangling and which tool to use for visualization. Do not wrangle and visualize with both tools.
3. Decide early on whether it would be more efficient to use one tool rather than both.
It’s possible to have an integrated workflow with R and your BI tool but not entirely convenient or friendly
As to the first point, many BI tools have built-in methods to integrate R into the tool. While the BI tool wasn’t built for R and R wasn’t built for the BI tool, many of the proprietary companies found it necessary to bridge the two as they both became more prominent. That being said, just because you can integrate both options doesn’t mean that you necessarily should.
Microsoft Power BI specifically offers the ability to read in and manipulate data by running an R script in the Power BI environment. This can be handy in dealing with particularly messy datasets. Running those datasets can be found here.
I found that the bridge between the two was just enough to get by for that project but that on a larger scale project with more data, it would take too long to implement. An interesting roadblock that I ran into was that the implementation of an R script into a hosted Power BI dashboard could only function under Power BI’s premium business license. As a resuly, I myself was unable to complete the project without coordinating with the company’s resident business analyst in charge of managing the business license. While it was still possible to work through, it was surely inconvenient.
Determine which tool to use for wrangling and which tool to use for visualization. Do not wrangle and visualize with both tools
A powerful visualization package in R is the ggplot2 library. With my strengths coming from this, I began creating visualizations completely in R and not realizing the complications that would arrive as a result.
One aspect of PowerBI that is used the most is its ability to have interactive visuals that can filter and sort the data in an intuitive manner. When creating R visuals and placing them into Power BI, these visuals lose that interactive power.
Visuals in PowerBI can be created quickly and while they cannot be customized nearly as much as the ggplot2 visuals can, I found that most of the visuals in PowerBI are just as useful as ones created with R. In this specific project, I decided to perform all of my data wrangling in R and visualize my data in Power BI as these appeared to be the most straight forward workflow.
Decide early on whether it would be more efficient to use one tool rather than both
I certainly wouldn’t say that one tool is dominant over the other but rather each has a specific use which it performs well. It is important to determine quickly if the use of both or one tool is necessary.
Looking back, I do believe that most of my project could have been performed completely using R’s capacity or PowerBI’s capacity. That being said, R’s ability to tidy data trumped that of PowerBI’s.
I found that a good analyst will know which tool works best for a specific problem and work accordingly. The more tools an analyst has will strengthen his/her capacity to tackle a problem for sure, but this does not mean that all tools should be used to solve a problem. There is a happy medium to the marriage between R and BI tools and it is up to the analyst to find that.